The dangers of reproducing while old
I had my first child when I was 36 years old, which made me want to understand the risks of having children at different ages. Before looking into this, my impression was that the main biological problems with old-age parenthood had to do with not having the necessary health and vigor to care for young’uns, and I had heard that older women have trouble getting pregnant. While those are real issues, there are many others worthy of consideration.
My read of the evidence is that the risks of miscarriage and serious health problems for children, including autism and birth defects, increase significantly with parental (both paternal and maternal) age. The data I could find for most risks is not very fine-grained and not very precise, but I think this qualitative description matches the data: Risks start rising at around 30 years old for both mothers and fathers, rises gradually through about 35 for mothers and 40 for fathers, and then sharply after that.
Interestingly, the ages at which things start to go wrong are similar for fathers and mothers, but the mechanisms are different. Sperm cells are produced throughout a man’s life, and each time a new cell is produced, there is a chance of a genetic mutation. Sperm are produced by copying the DNA of other short-lived cells, which are themselves produced in the same way, so mutations accumulate. Women’s egg cells, however, are all present when a woman is born, but over time they accumulate damage.
If this is correct, then there are two ways to reduce these risks: have kids when young, or use frozen gametes from your younger selves. If you’re already in the danger zone and don’t have frozen gametes, pre-implantation genetic testing may be able to screen out embryos that have certain genetic defects, and thus reduce the risk of some bad outcomes.
My advice:
- If you want to have kids at some later age, and that later age is >= 35 for a woman or >= 40 for a man, freeze your gametes ASAP.
- If you’re already past those age thresholds and you have the means, consider in-vitro fertilization so you can take advantage of pre-implantation genetic testing.
In “the dangers” section below I summarize some evidence on how parental age interacts with various risks. What’s not obvious is the relationship between the different risks. That is, are they mostly independent of each other, or is a child born with e.g., a heart defect much more likely to be autistic? They are not independent. For example, Eide et al. find a significant correlation between birth defects and intellectual disability. So if you want to know “what are the odds my kid comes out totally healthy”, I think just looking at the highest risk and ignoring the others is reasonable.
If you’re interested in the details supporting the above conclusions, read on.
Technical jargon
Skip this if you know these terms.
Prevalence
The prevalence is what fraction of the population has the outcome of interest. Basically:
(number of people with the outcome) / (number of people that were studied).
Odds ratio
An odds ratio is a ratio of how likely the outcome of interest is in the condition of interest, to how likely it is in some reference condition. For the data below, the condition is always a particular parental age range, and the reference condition is some other age range that the researchers chose. For example, say we set the reference age to 25, and our outcome of interest is being born with green hair. If a study finds that children of fathers aged 30 have 1/10 odds of being born with green hair, and the children of fathers aged 25 have 1/100 odds of being born with green hair, then the odds ratio for age 30 is 1/10 / 1 / 100 = 10.
95% CI
A 95% CI (confidence interval) is a range of values. Under certain assumptions1 there is a 95% chance that the true value falls within that range.
Pre-implantation genetic testing
Pre-implantation genetic testing is done on embryos that have been fertilized in-vitro before implanting them into a woman (more details here). After developing for about 10 days, embryos have enough cells that some can be removed for genetic testing. Sordia-Hernandez et al. look at the effects of testing for aneuploidy, which is a specific kind of genetic defect which often results in miscarriage or abortion. It finds significant benefits for women >= 35 years old, but not for younger women.
Note that for almost everything else, the outcome being tested for is bad, whereas here it is live birth rate, or the odds of a child being born alive after an embryo is transferred into a woman.
| Mother’s age | Live birth rate odds ratio 95% CI (relative to no genetic testing) |
| < 35 | 0.56, 1.34 |
| >= 35 | 1.07, 2.84 |
Very recently, some companies have started offering more in-depth genetic screening for embryos, such as assessing risk for polygenic traits, meaning influenced by many genes. The companies offering this service claim all sorts of benefits, such as reducing the risk of cancer and diabetes, but I don’t think it’s been independently evaluated, and it’s probably too new to truly evaluate, since there’s a very small number of people alive who were screened in this way. Here’s Gene Smith’s post that’s very enthusiastic about such screening and tells you how to go about it, and my response trying to summarize a skeptical position.
So if you’re older and you don’t have frozen gametes, should you do IVF just so you can do pre-implantation genetic testing?
Pros:
- Very effective at detecting aneuploidy, and thus increasing live birth rate per pregnancy.
- You can choose the child’s sex.
- If you opt for polygenic screening, it is possible to reduce other health risks and possibly improve other desirable traits like IQ. Again, see Gene Smith’s post for more details on this.
- I haven’t seen any strong evidence that IVF results in worse health outcomes. Note there are many studies that show worse outcomes for IVF, but since IVF is largely used by people who have fertility problems, and differences seem to disappear entirely when controlling for this. More here.
Cons:
- Expensive in time and money (maybe $25,000 in 2023).
- Will be more expensive and / or less effective for women who produce fewer eggs per retrieval, which is mostly older women.
- There is some evidence that IVF results in differences in the embryo that might possibly result in less healthy people (vs old-fashioned conception). I think the odds that this results in worse outcomes are quite low, but it’s worth mentioning.
The dangers
Miscarriage
This chart from Magnus et al. shows the absolute risk by mother’s age. Y-axis is the proportion of pregnancies that end in miscarriage:
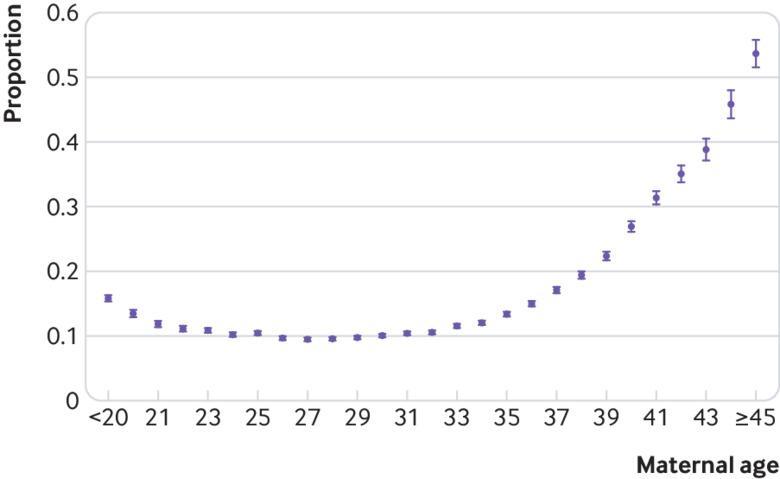
And here’s some data from du Fossé et al. on the risk by father’s age. For the absolute risk, I assumed the absolute risk for the reference age is 10%, which seems to be about the value for a 27 year old woman from the chart above.
| Father’s age | Odds ratio 95% CI | Absolute risk 95% CI |
| 25-29 | reference | 10% |
| 30-34 | 0.9, 1.21 | 9%, 12.1% |
| 35-39 | 0.92, 1.43 | 9.2%, 14.3% |
| 40-44 | 1.06, 1.43 | 10.6%, 14.3% |
| >= 45 | 1.13, 1.81 | 11.3%, 18.1% |
Autism
Prevalence
People with a huge range of abilities and tendencies are all diagnosed with autism, and there’s a lot of debate about the accuracy of many diagnoses. However “profound autism” is a diagnosis with much clearer criteria. Hughes et al. defined profound autism “as children with autism who were either nonverbal or minimally verbal or had an (intelligence quotient) IQ <50”. That study estimated the prevalence of profound autism in the USA as:
| Female | 1.88 / 1000 = 1 / 532 |
| Male | 7.18 / 1000 = 1 / 139 |
| Overall | 4.59 / 1000 = 1 / 218 |
These numbers seem shockingly high, but they do somewhat match my casual observations. I don’t know a lot of children, but I know of at least 2 profoundly autistic boys.
Risk by parental age
The studies I found on the impact of parental age did not restrict themselves to just profound autism, so it’s possible that parental age interacts with profound autism differently, but my guess is it’s at least qualitatively correct.
Here are the results from Durkin et al., who looked at both the father’s and mother’s ages. For the absolute risk for fathers, I used the number of autism spectrum disorder cases / size of the “Birth Chort Comparison Group” for the father’s or mother’s reference age, extracted from table 3 of the paper. For fathers that’s 322 / 67,080 = 0.48%. For mother’s that’s 366 / 75,053 = 0.49%. These numbers are close to the overall risk of profound autism from Hughes et al. above, but this study considered any autism diagnosis, so something is probably wrong either with my calculation or with one or both of these studies.
| Father’s age | Odds ratio 95% CI | Absolute risk 95% CI |
| <20 | 0.4, 1.0 | 0.19%, 0.48% |
| 20-24 | 0.7, 1.1 | 0.34%, 0.53% |
| 25-29 | Reference | 0.48% |
| 30-34 | 0.9, 1.2 | 0.43%, 0.58% |
| 35-39 | 0.9, 1.3 | 0.43%, 0.62% |
| >= 40 | 1.1, 1.8 | 0.53%, 0.86% |
| Mother’s age | Odds ratio 95% CI | Absolute risk 95% CI |
| <20 | 0.5, 1.0 | 0.25%, 0.49% |
| 20-24 | 0.8, 1.1 | 0.39%, 0.54% |
| 25-29 | Reference | 0.49% |
| 30-34 | 0.9, 1.3 | 0.44%, 0.64% |
| >= 35 | 1.1, 1.6 | 0.54%, 0.64% |
Note from paper: “Because the increased risk was similar for ages 35–39 and ≥40 years, the high-risk maternal age category was defined as ≥35 years.”
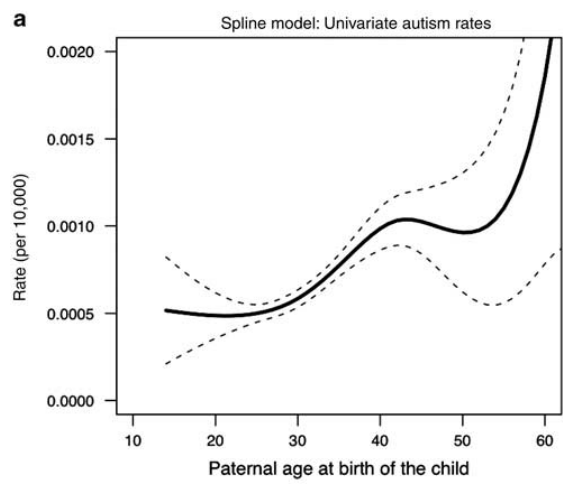
And here are results from another study that looked only at the father’s age:
| Father’s age | Odds ratio 95% CI |
| 15-29 | Reference |
| 30-39 | 1.0, 1.42 |
| 40-49 | 1.07, 1.87 |
| >= 50 | 1.26, 3.88 |
This chart shows absolute risks from that same study:
Chromosome disorders
Prevalence
Caron, Tihy, and Dallaire find that of mothers aged >= 35, 1.79% or 1 / 55 have a chromosomal disorder in the second trimester. Note that some chromosome disorders result in miscarriage earlier than that, so the true prevalence is certainly higher.
Risk by parental age
To compute absolute risk, I took the prevalence number from above and then divided it by 5.66 (the middle of the odds ratio CI for mothers aged >= 35) to get 1.79 % / 5.66 = 0.32%.
| Father’s age | Odds ratio 95% CI | Absolute risk 95% CI |
| <20 | 1.01, 1.89 | 0.32%, 0.60% |
| 25-29 | reference | 0.32% |
| >= 40 | 1.12, 1.52 | 0.36%, 0.49% |
From Fang et al.
| Mother’s age | Odds ratio 95% CI | Absolute risk 95% CI |
| <20 | 0.54, 0.88 | 0.17%, 0.28% |
| 20-34 | reference | 0.32% |
| >= 35 | 5.13, 6.2 | 1.64%, 1.98% |
From Ahn et al.
Urogenital defects
Prevalence
1.60 / 1000 = 1 / 625. Source.
Risk by parental age
I didn’t find an easy way to calculate absolute risk.
| Father’s age | Odds ratio 95% CI |
| <20 | 1.03, 2.19 |
| 25-29 | reference |
| >= 40 | 1.07, 1.52 |
From Fang et al.
| Mother’s age | Odds ratio 95% CI |
| 20-34 | reference |
| >= 35 | 1.13, 1.89 |
From Ahn et al.
Heart defects
Prevalence
137.1 / 10,000 = 1 / 73. Source.
Note: this seems really high to me. Maybe most of these are not very serious, or maybe I know people who were born with heart defects but I don’t know they have them.
Risk by parental age
I didn’t find an easy way to calculate absolute risk.
| Father’s age | Odds ratio 95% CI |
| <20 | 0.96, 1.16 |
| 25-29 | reference |
| >= 40 | 1.01, 1.2 |
From Fang et al.
| Mother’s age | Odds ratio 95% CI |
| <20 | 0.79, 1.1 |
| 20-34 | reference |
| >= 35 | 1.06, 1.24 |
From Ahn et al.
Notes
-
Which scientists sometimes violate and thus invalidate their own results, but for now I’m just assuming these stats are sound. ↩